I had actually meant to do something like this with the original retrospective, but didn’t have the time to get the data in. I thought it would be fun to have a running data set to looks for trends and any other interesting information that may be gleaned from this project, so here we go!
This data comes only from the NES games, as that’s the only console I’ve completed so far. New analysis posts will be released with every completed console.
Data did not include Dragon Warrior III, as it will be played on the Gameboy, nor does it include Duck Hunt.
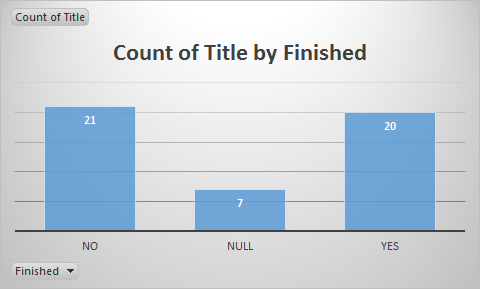
Above you can see games I’ve actually played to completion, those I haven’t, and those that can’t be beaten, signified as NULL. For the most part we’ll be disregarding games that can not be beaten. I honestly can’t say I’m all too happy about breaking even on finished and unfinished games, but with the difficulty of the NES era games, I’m not all that surprised either… On that note…
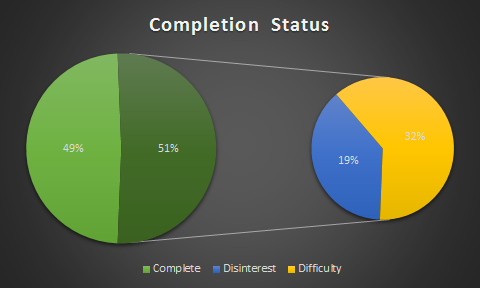 Of the games I didn’t finish, only about 30% were do to disinterest, with the other two thirds due to the game just being too hard.
Finally, and try not to get too surprised, games I actually completed amassed a higher score count than games I did not, though the two are still fairly close.
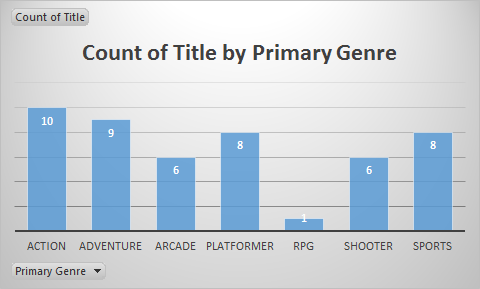
Here are the counts of games played sorted by their primary genre game. Run & Gun games like Contra and Mega Man are listed as Shooters, Run & Punch/Stab/Whip listed as Action, and Run & Jump games like Mario listed as Platformers.
This will be an interesting chart to see evolve, as different consoles tend to lean more towards certain genres.
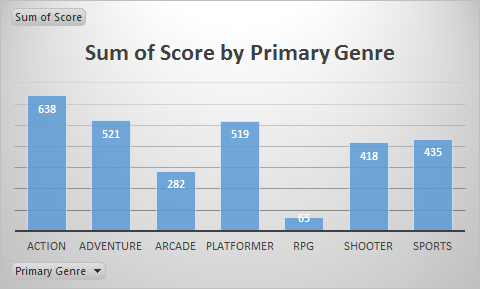
Total points per genre isn’t terribly interesting at this point, but it is telling of personal preference. You can see that despite playing two more Sports titles than Shooters, their scores are nearly even. This will be another interesting chart to watch as time goes on, though I can see it getting somewhat skewed at some point.
Update!
Silly me, completely forgot to include “useful” data!
Given the small data pool, averaging scores makes a lot more sense. This will be equally important moving forward when consoles like the RPG heavy PS1 or Platformer heaver N64 come into play. Here, my genre preference becomes even more clear, at least on the NES, but others are better represented.
More interesting is when I break it down to completion results. You’d expect to see higher average scores given to games I actually finished, but that isn’t always the case. For Action titles, this is probably because I was unable to actually beat most of them. With Sports titles, I preferred games that actually had obtainable goals as opposed to just doing the same thing over and over, whereas the opposite was true for Arcade games.
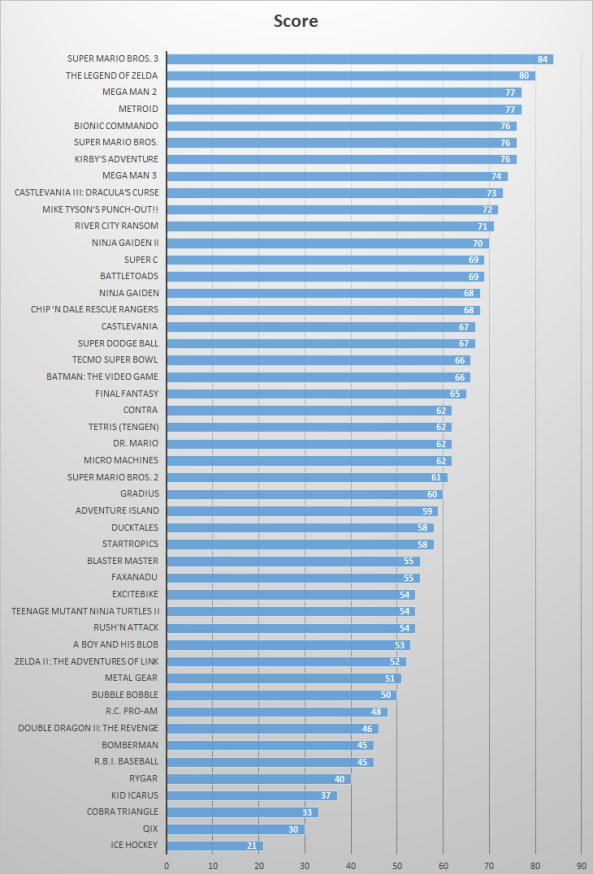
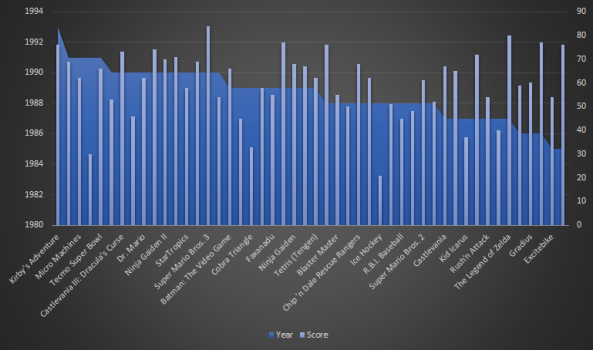
Above is a nice, graphical interpretation of all games played, though it’s not particularly useful. However, if we take those games and scores and slap release dats on them, that’s something to look at.
I’m not really sure what the takeaway from this one is, and I think it’ll be more interesting to look at as more years are added to it. The better games seemed to come from the beginning and end of the console’s lifespan, with it averaging out around the end of the 80’s.
As this project goes on, I’ll probably create two of these reports per console completion: One for the completed console by itself, and one for the total data set. This report is effectively both, as it represents total data, which includes only a single console.
TL;DR – Graphs are fun.


